A Lab Manual for PSYC 301: Elementary Statistics for Psychology
Department of Psychological & Brain Sciences at Texas A&M University (until May 2022)07 October 2023
Preface
Howdy!
This is a lab manual for PSYC 301: Elementary Statistics for Psychology at Texas A&M University. It is an Open Educational Resource, and is free to read, licensed under the Creative Commons Attribution-ShareAlike 4.0 International License.


![]()


It complements the main class, which also uses an OER textbook, Learning Statistics with jamovi by Navarro & Foxcroft (2019), linked here.
In short, the class is more about the theory behind statistics, and the lab is more about practical application, especially writing up research that employs statistics. Among other things, your TA will guide you through this manual by directing you which chapters to read, what to pay particular attention to, and which exercises to practice with. More specific goals are listed below.
0.1 Goals
The purpose of this manual and the other resources listed above is to give you the resources necessary to do the following:
Learn jamovi. Using the free statistical software jamovi, leverage the knowledge of statistical theory that you learn in the main class in order to carry out small-scale, in-class exercises. jamovi employs an easy-to-use graphical user interface (GUI, pronounced “gooey”), but is built on top of the programming language R (R Core Team, 2023), which has become extremely popular among data scientists during the last two decades. Chapters 1-9 of this lab manual cover learning jamovi.
Design and conduct your own study in small groups. This will take the form of a survey that you will design and distribute using Google Forms (see above). You already have a template for this survey in your shared group folder in Google Drive (under the main instructor’s account). Please save this Google Form (i.e., GoogleFormsTemplate) as a new form with a name that appropriately reflects the topic of your survey (e.g., SleepAndAcademicAchievement). There is more on Google Drive and Google Forms down below. Chapter 10 of this lab manual provides a general overview of this portion of the research project.
Analyze the data from your study. Using the same software (jamovi), perform the front-end work on the main project assignment of the lab: a small-scale research paper. Specifically, you will import raw data from your survey into jamovi, modify the data however necessary (both covered in Chapter 11 of this manual), and carry out the appropriate statistical analyses and visualizations quickly and efficiently These statistical procedures are covered in Chapters 3-9 of this manual, but specifically the following chapters in the following order: 6 and 8, followed by 7). The output of these analyses will underlie what you write in the Results and Discussion sections of your paper (see below).
Write a paper (in four parts). Based on both (1) through (3) directly above, you will write a small-scale research paper. This effort will be staged through four, major writing assignments based broadly speaking on each of the four typical sections of a research paper in psychology: Introduction, Method, Results, and Discussion.1 However, due to the timing of statistical topics in the main class, the paper will take the following, slightly modified, though still very common form:2 Introduction, Method, STUDY 1 (Results, Discussion), STUDY 2 (Results, Discussion), General Discussion. Each assignment will be broken into two parts: (1) a rough draft that will be peer-reviewed through Peerceptiv (via Canvas); and (2) a final draft that will be submitted through Turnitin (also via Canvas). This results in a total of eight writing assignments to turn in. Perceptiv and Turnitin are covered in more detail below. Chapters 12-17, as well as all the Appendixes (A-J), are dedicated to showing you how to write just such a paper.
0.2 Resources
As noted above, you will need certain resources in order to achieve these goals. What follows are two lists of all the resources you will need to do so, all of which are available to you at no extra cost (beyond the tuition you have already paid). The first list consists of fixed resources, meaning that they are either textbooks, handouts, videos, or data sources that are given to you as-is. The second list is active, meaning generally that it’s software that you can use freely, but you must do the work for it to be meaningful.
0.2.1 Fixed resources
0.2.1.1 This lab manual
This lab manual (Bolger, 2019) was created also using the programming language R within RStudio Desktop, along with the R package bookdown (Xie, 2023), which uses rmarkdown (Allaire et al., 2023) to create books. R Markdown is a markdown language for R created by the popular integrated development environment (IDE) RStudio (RStudio Team, 2015), which makes programming in R easier.
Several other R packages were also used throughout. Many of these are represented by the hexagon icons near the top of this page. But note that hexagon icons are just a popular aesthetic. Some of the most important packages in R (and even in this manual) are not represented by hex icons.
0.2.1.2 The jamovi user guide
The jamovi user guide (The jamovi Project, 2019) is linked here. The jamovi website has a user manual for basic functions.
See Figure 0.1 below.
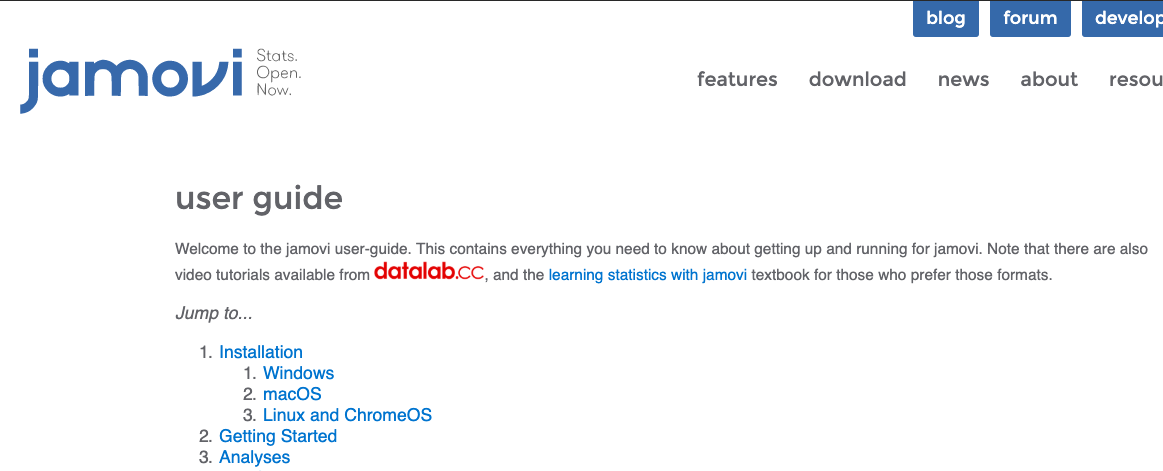
Figure 0.1: The jamovi user guide.
0.2.1.3 The jamovi blog
The jamovi blog (Love et al., 2019) is linked here. This blog from jamovi has occasional entries that can be helpful.
See Figure 0.2 below.
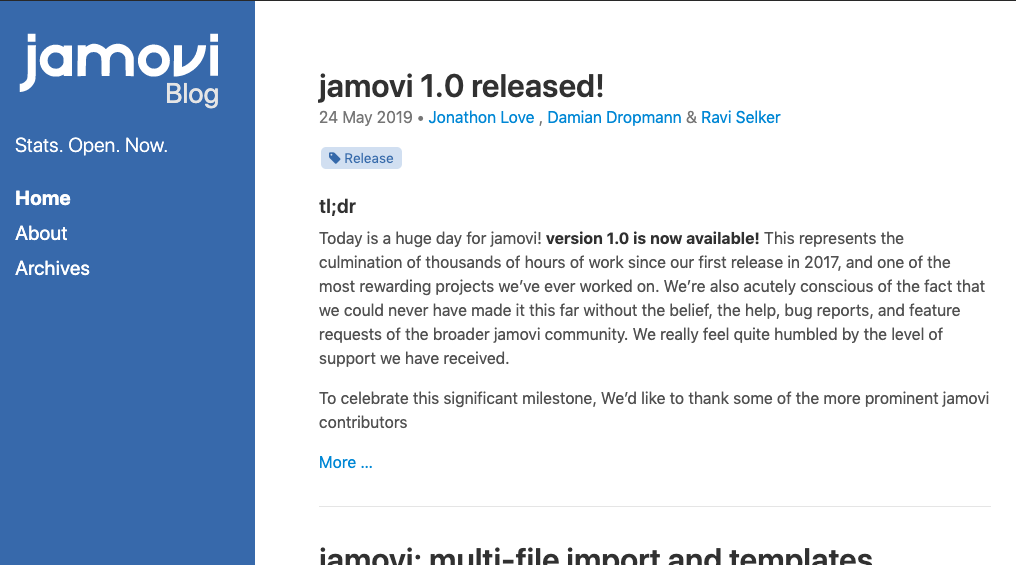
Figure 0.2: The jamovi blog.
0.2.1.4 Learning statistics with jamovi
This is the course textbook (Navarro & Foxcroft, 2019). It is linked here.
See Figure 0.3 below.
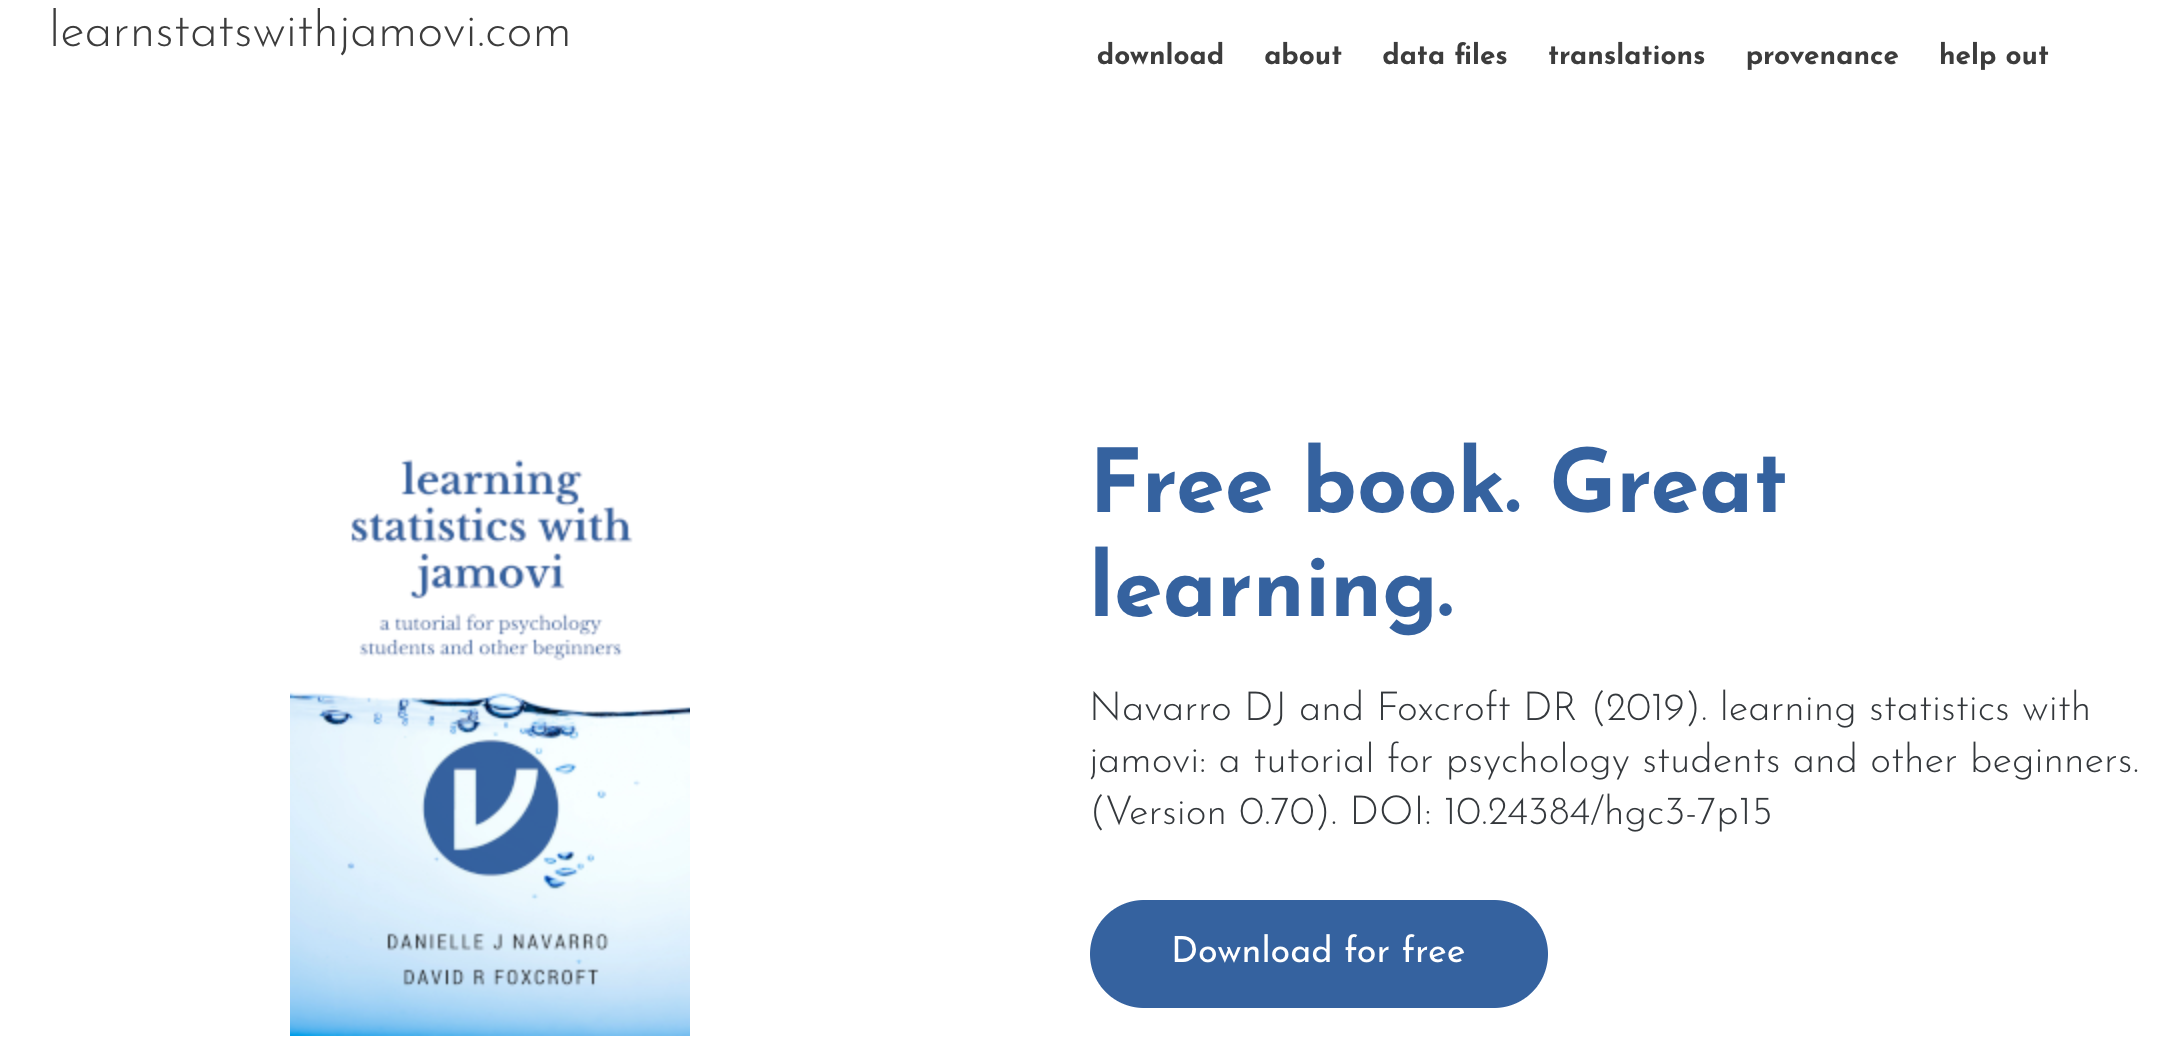
Figure 0.3: Learning statistics with jamovi.
0.2.1.5 The jamovi quickstart guide
The jamovi quickstart guide (Rafi, 2019) is linked here. This is another free, but strictly online book that shows you how to carry out various functions in jamovi.
See Figure 0.4 below.

Figure 0.4: The jamovi quickstart guide.
0.2.1.6 datalab.cc
datalab.cc (Poulson, 2019) is linked here. This is a company created by Dr. Barton Poulson. The company is dedicated to teaching people about data science. One of the tools that gets extensive attention in the website is jamovi.3 There are over 50 YouTube videos (totaling nearly 5 hours!) available for different functions in jamovi, all available under the Attribution 4.0 International (CC BY 4.0) Creative Commons license. This means that they are free for me to assign, and you to use. Note that we will not provide direct links to the individual videos.4 Rather, we will tell you which numbered video to scroll to. To choose a video, click in the upper right-hand corner of the video screen. A drop-down menu will appear, where you scroll down to choose particular videos. If you are at Texas A&M, these tutorials are also available through the LinkedIn Learning tutorials, which you can go to through the Howdy! portal.
See Figure 0.5 below.

Figure 0.5: datalab.cc.
0.2.1.7 Statistics for psychologists: An online textbook
This textbook (Wendorf, 2018) is not the textbook for this class, but it is linked here. It is a free online textbook also available to you under the Attribution 4.0 International (CC BY 4.0) Creative Commons license. There are only a few chapters that are relevant for this course, namely the ones having to do with jamovi. There is an easier online venue to view the textbook than the Open Science Framework (which consists of individual .pdf files, which you are allowed to download for free). But the GitHub site of Dr. Wendorf is easier to navigate. We will link to tutorials here, especially in Chapters 3-9 of this lab manual.
See Figure 0.6 below.
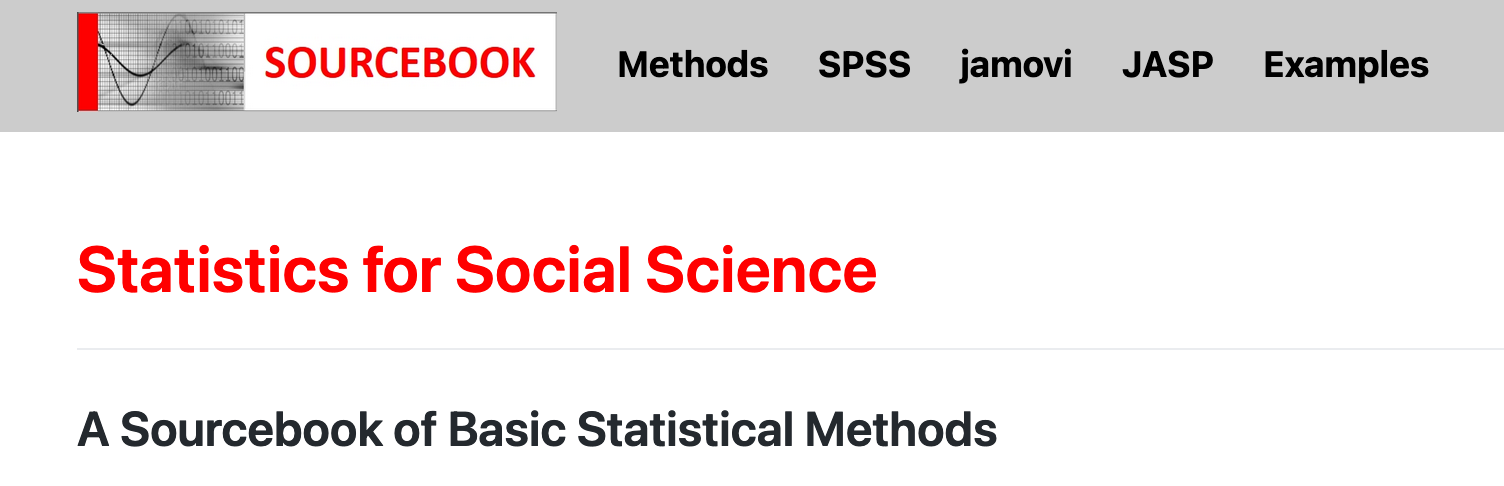
Figure 0.6: Statistics for social science - A sourcebook for basic statistical methods.
0.2.2 Software
0.2.2.1 jamovi
jamovi (The jamovi Project, 2019) is linked here, which again, is a friendly graphical user interface (GUI) for basic functions from the powerful open-source statistical software R (R Core Team, 2023). jamovi (all lowercase) was designed to provide the basic functionality that SPSS provides. SPSS is more common in the social sciences (for now), but you have to pay a lot of money to download it on your computer. jamovi can be downloaded and installed onto the following operating systems: Windows, Macs, Linux, and ChromeOS. See the next section for more detailed rationale for using jamovi.
See Figure 0.7 below.
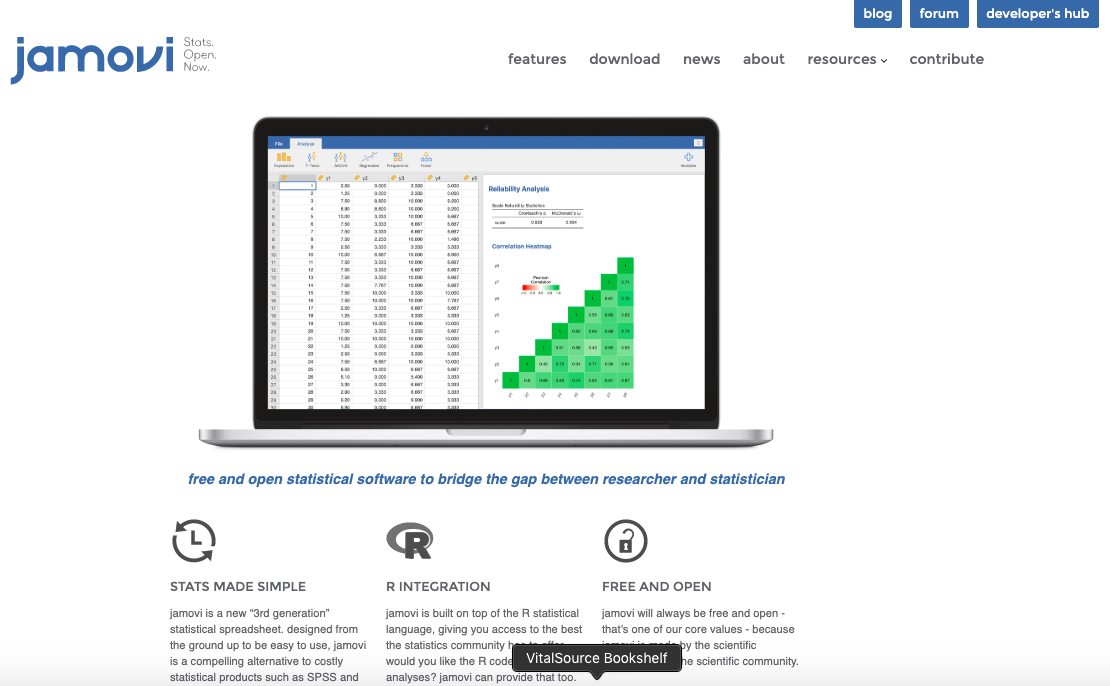
Figure 0.7: jamovi.
NOTE: This manual also uses the R package jmv, which is a package that generates jamovi output from within R itself. The formatting of the output is slightly different, especially with respect to the number of decimal places. These differences will be noted throughout as the need arises.
0.2.2.2 Canvas
This is the learning-management system used at Texas A&M University. It is linked here.
See Figure 0.8 below.

Figure 0.8: Canvas at Texas A&M.
0.2.2.3 Peerceptiv
Peerceptiv is linked here. It is a peer-review platform, and will be used to evaluate all rough drafts in this lab. Peerceptiv is not free, per se, but Texas A&M University has acquired a license for all its students to use. You will log in to it through Canvas.
See Figure 0.9 below.
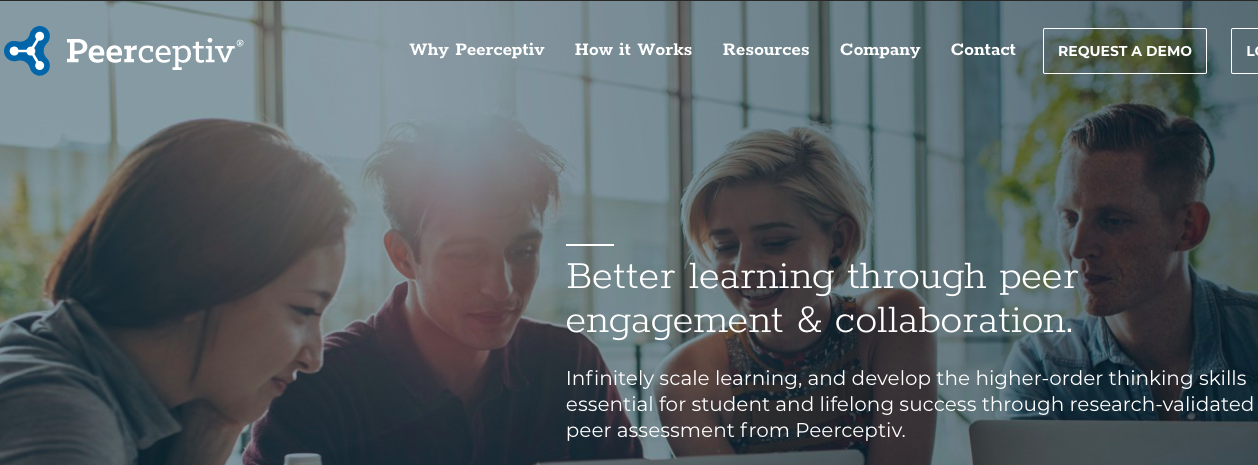
Figure 0.9: Peerceptiv.
WARNING: Do not ever log in to Peerceptiv through the Peerceptiv website to upload documents. Instead, always log in through the links provided in Canvas.
0.2.2.4 Turnitin
Turnitin is linked here. It is also commercial software, the license to which you have already contributed with your tuition. This is where you will upload all your final drafts. Turnitin is plagiarism-detection software. Plagiarism is not that likely in this lab since you will be working in groups on unique research projects with their own data. However, it has, in the past, detected within-group plagiarism in this class (all student writing must be independent, even within groups).
See Figure 0.10 below.

Figure 0.10: Turnitin.
WARNING: Do not ever log in to Turnitin through the Turnitin website to upload documents. Instead, always log in through the links provided in Canvas.
0.2.2.5 Google Apps for Texas A&M
Google Apps at Texas A&M is linked here.
See Figure 0.11 below.
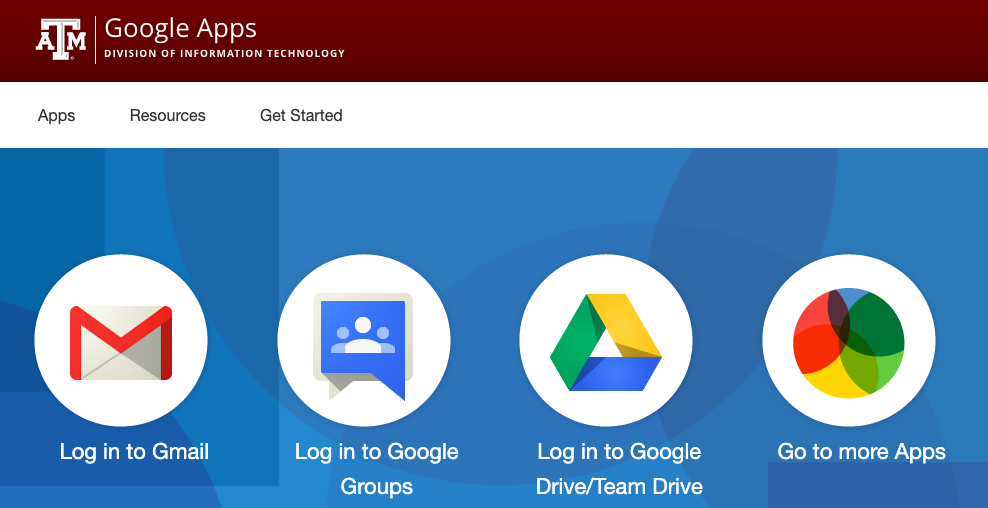
Figure 0.11: Google apps at TAMU.
Google Apps at Texas A&M is a suite of cloud-based productivity software that you have available to you since you paid for it already with your tuition (Google Apps is also available for individuals for free, but Google Apps for Education is an enhanced suite that must be paid for by institutions). The main programs you will use are the following:
0.2.2.5.1 Google Drive
Linked here, Google Drive will allow you to store the files from your group. Each student group will share a folder that will be located on the Google Drive of the course instructor. That is, your course instructor will be the owner. Your TA will also have access to this folder. There will be some key files that they will provide to each group. All documents except individual writing assignments will go into this folder. If you are at Texas A&M, there are tutorials through LinkedIn Learning in the Howdy! portal. Google Drive also provides you access to several kinds of productivity software, the following of which are critical to this class:
0.2.2.5.2 Google Forms
Google Forms is linked here. You will use Google Forms to design and send out your survey. There will be a template we provide for you in your shared Google Drive for your group. Texas A&M also has tutorials through LinkedIn Learning, accessible through the Howdy! portal.
0.2.2.5.3 Google Sheets
Google Sheets is linked here. You will use Google Sheets very briefly to house and then export your data from Google Forms. Texas A&M also has tutorials through LinkedIn Learning, accessible through the Howdy! portal.
0.2.2.5.4 Google Docs
Google Docs is linked here. We highly suggest you use Google Docs to write your papers. The reason is that you can save different versions of it. In fact, just before you submit your writing assignments to Peerceptiv or Turnitin (see above), you could save that version of your Google Doc (File > Version history > Name current version; and name it, say, Introduction_RoughDraft), and it will be time-stamped. Even if you change your document subsequently, you can always revert it back to an earlier version, as can your TA or professor if you grant them Can Edit access. Tutorials on Google Docs are also available through LinkedIn Learning at Texas A&M.
0.3 Rationale for jamovi
You might be wondering why this lab manual focuses on jamovi and not, say, the more popular statistical-analysis software in the social sciences: SPSS (IBM Corp., 2019).
Indeed, jamovi is new and not as popular (at least not yet) in the social sciences, including Psychology. To be honest, SPSS is still the most popular among professors in Psychology. You are likely to encounter SPSS if you, say, join a lab in a Psychology Department.
However, jamovi offers some features that exceed in quality those of SPSS (at least the current version):5
Cost. jamovi is free for you to download onto your laptop (Windows, Mac, Linux, and ChromeOS). Note that you can also download SPSS on to your computer, but it will cost you. It is marketed through various third-party retailers. See the SPSS website for details.6 In the end, however, jamovi turns out to be easier to use than SPSS, though the underlying statistical analyses are the same.7
Navigability. jamovi’s GUI is much easier to navigate than that of SPSS. jamovi is really, really new (established in 2017), and SPSS has been around since the 1960s. As a result of its age and, presumably, a disinclination to field user complaints about broken code, SPSS carries a lot of menu “baggage” that retains backwards-compatibility with earlier versions of the software. That is, you can run statistical analyses in SPSS using code that your wrote decades ago. The cost of that failure to get rid of older functions is that SPSS has accumulated a lot of menu clutter. This can be frustrating for beginners. jamovi has no such clutter.
Compactness. jamovi keeps its data, code, and output all in one file (a file with the .omv suffix). This makes analyses really easy to share with classmates, TAs, and (eventually) colleagues. You just send them the file that you worked on, and it opens up for them exactly the same way you left it when you last saved it. SPSS is not like this as the data, the syntax (to run the statistical procedures), and the output are all stored as three separate files (.sav, .sps, and .spv files, respectively). This can be frustrating. In jamovi, there is only one file (.omv).
Convenience. If you send someone a .omv file from jamovi to work on, but they don’t have jamovi installed, naturally they can just download and install it for free,8 and then get to work (as long as they have the space on their hard drive). For SPSS in contrast, if the person you are sharing your SPSS output with does not have SPSS available (on the computer they’re currently working on), then they will either have to find a computer with SPSS on it or purchase and SPSS license to open your analysis. Alternatively, you could export all output to .pdf or .htm format. But then they would only be able to view your output, and not be able to change anything. Moreover, if you just want to share data, you need to export it to a text-delimited file so that your colleague can open it up on their end. All of this is solved by jamovi, where everything is all in one file.
0.4 Organization of this manual
The lab manual is organized as follows.
Unit I is Basics.
Chapter 1 is an introduction to jamovi, namely: how to install it on your own computer, how to add modules, navigating the interface, sharing files, etc.
Chapter 2 shows you how to, enter and import data into jamovi, as well as manipulate it, transform it, etc.
Chapter 3 shows you how to generate the basic statistics (descriptive statistics) that must always be reported in research. These descriptive statistics also lay the foundation for the inferential statistics that follow in subsequent chapters.
Chapter 4 tutors you on how to use the graphical capabilities of jamovi.
Unit II is Inferential statistics.
Chapter 5 begins the first such test in this class: categorical data analysis, and in particular, chi-square \((\chi^2)\), which you can use when the outcome variable is a discrete count of something (like number of people in the class), and your predictor is a categorical variable with (hopefully) very few levels (e.g., Class Level: Freshman, Sophomore, Junior, Senior).
Chapter 6 covers t-tests, which you use when your outcome variable is continuous (e.g., body weight), and you have a single, dichotomous predictor variable (e.g., Dietary Preference: vegetarian vs. omnivore).
Chapter 7, Correlation and linear regression, shows you the analysis to use when you have a single, continuous outcome variable, and one or more continuous predictor variables, like IQ and GPA.9
Chapter 8 is an extension of chapter 6, but instead of having just 2 levels for the single, categorical predictor variable, it can have 3 or more levels. This is called a one-way ANOVA. For example, you might have salary as predicted by whether you’re faculty, staff, or a student.
Chapter 9 extends the ANOVA model from Chapter 8 even further by allowing you to have 2 or more predictors, each of which is categorical with 2 or more levels (e.g., Degree of Happiness as predicted by Gender and Class Level (freshman, sophomore, junior, senior)). This is called a factorial ANOVA
Unit III is Research Projects.
Chapter 10 is about getting your study designed and your data collected.
Chapter 11 is concerned with getting the data you have collected in your project into a format that you can use for the analyses, and then carrying out those analyses.
Unit IV is Writing.
Chapter 12 is an overview of the process and product of a research paper in Psychology.
Subsequent chapters get more specific.
Namely, Chapter 13 covers how to write the Introduction section.
Chapter 14 covers how to write the Method section.
Chapter 15, introduces you to how to report the Results section.
Chapter 16, introduces you to how to report the Discussion section.
And Chapter 17 shows you how to write the General Discussion, which ties everything together.
0.5 Main outcome of class
When you finish this class, as well as this lab, you should not only understand the theoretical underpinnings of data science (a more general label for statistics), but also know how to communicate about it. This kind of knowledge should serve you well for the rest of your life, not only professionally, but also personally. You are bombarded every day with statistics, especially in the news. There is a reason that it is required by most departments at the university: Knowledge of statistics makes you into a more informed citizen in general.
So let’s take the first steps on the way to becoming a data analyst!!
References
This is sometimes referred to as IMRaD structure, an acronym composed of each of the section’s first letters.↩︎
In fact, it is more common.↩︎
There are also free video tutorials on other tools for data science (including SPSS if you are so inclined). You can find the full list of tutorials on data-science tools here. There are also some videos on the theory of statistics, which may be helpful in the main class: datalab.cc statistics series↩︎
Linking directly just multiplies the number of URLs that we need to keep updated, something we would rather avoid.↩︎
The authors of your main textbook, Navarro & Foxcroft (2019), also have a list of reasons to prefer jamovi over SPSS. This list can be found at the very beginning of Chapter 3 of that textbook↩︎
You can find SPSS on designated computers throughout campus. This includes the computers in your lab because the department has purchased these licenses↩︎
We should mention that SAS is another commercial statistical-analysis software company that actually has made their extremely powerful software freely available for educational purposes. You can download it for free as SAS University Edition, and it will run on your computer through your browser as a virtualized application. The downside is that few psychologists use SAS, and it is notoriously difficult to learn. You can also find SAS on the VOAL↩︎
… unless your collaborator refuses to download jamovi onto their own computer (a possibility, presumably)↩︎
This is another lie; there is no limit to the number or types of variables in linear regression, but we keep it mostly simple to start with in this chapter.↩︎