E: Results example
The survey design and data for the example Results sections below are adapted from a classroom project by Fettig, López Fuentes, and Villarreal (2019).
Study 1
Results
In this portion of the study, we looked at the effects on overall sleep quality from two categorical variables. The first was whether students were involved in extracurricular activities. This was answered as either Yes or No in the survey, and therefore had two levels. The second was their employment status, and could be answered as No (not employed), Part-time, or Full-time. Therefore, it had three levels. The variable Extracurricular Activities was analyzed using an independent-samples t-test, and the variable Employment Status was analyzed using a One-Way ANOVA. For the t-test, we used Welch’s test, which is corrected for heterogeneity of variance, whereas in the One-Way ANOVA, we tested the assumption of homogeneity of variance with Levene’s Test.
Extracurricular Activities
The results of the analysis of Extracurricular Activities on Sleep Quality is represented in Figure 1 below.
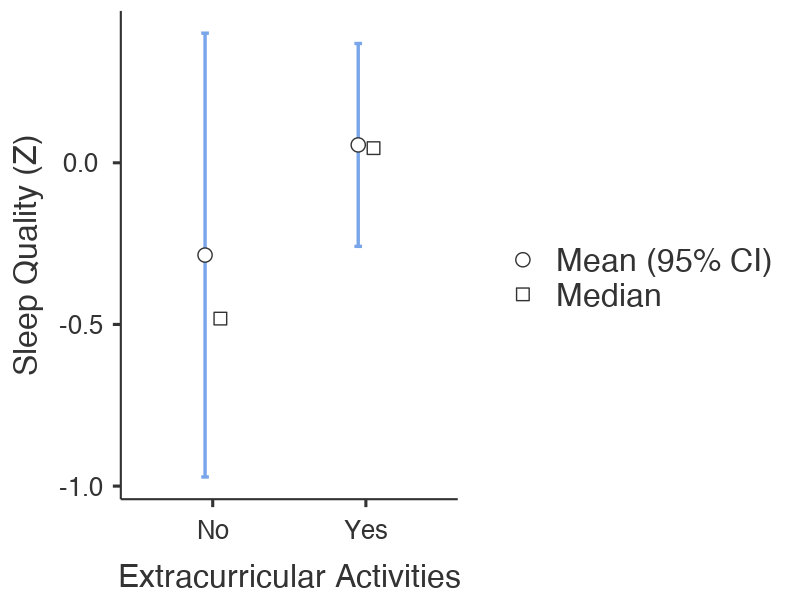
Figure 17.2: Figure 1. The effect of extracurricular activities on sleep quality. Error bars represent the 95% confidence interval. Sleep quality is on a standardized scale. (NOTE: In the 7th edition of the APA Style Manual, the figure label should actually go above the figure (unlike here), followed on the next line by a description in italics, followed below that by the figure itself)
Although participants who reported being involved in extracurricular activities indicated that their sleep quality was better overall (M = 0.0522, SD = 0.891, n = 31) than their counterparts who reported not being involved in extracurricular activities (M = -0.285, SD = 0.858, n = 6), the difference was non-significant, Welch’s t(7.25) = -0.885, p = .405, d =-0.384, 95% CI of the difference in means [-1.35, 0.87]. It seems that whatever differences there were between the groups may have been due to chance.
Employment Status
The results of the analysis of Employment Status on Sleep Quality is represented in Figure 2 below.
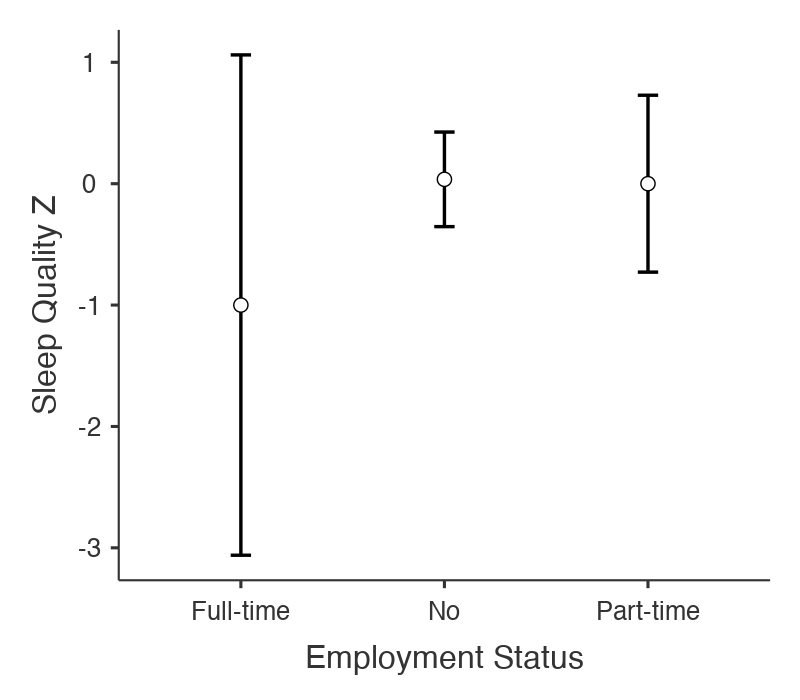
Figure 17.3: Figure 2. The effect of employment status on sleep quality. Error bars represent the 95% confidence interval. Sleep quality is on a standardized scale. (NOTE: In the 7th edition of the APA Style Manual, the figure label should actually go above the figure (unlike here), followed on the next line by a description in italics, followed below that by the figure itself)
There seems to be a trend for participants who are working full time to report having lower sleep quality (M = -0.798, SD = not available, n = 1) than either the participants who were not working at all (M = 0.0124, SD = 0.915, n = 28) or who were working part-time (M = 0.0563, SD = 0.831, n = 8). However, there were no significant differences among the groups, F(2,34) = 0.504, p = 0.609, partial eta-squared = 0.029. Thus, although there were some trends in the data, nothing was statistically significant.
We also ran post-hoc comparisons\(^{\dagger\dagger}\) using the Holm correction. There was no significant difference between those who reported working full time and those who reported not working at all, t(34) = -0.886, p = 1. Nor was there any significant difference between full-timers and those who reported working part time, t(34) = -0.897, p = 1. Finally, there was no significant difference between the part-timers and those who reported not working at all, t(34) = -0.122, p = 1.]
In fact, as is clear to see, there was only one participant who indicated they were working full time. These results cannot be trusted since there is no within-group variance associated with a factor level with an n of 1.
If we drop that level and re-run the analysis between the students either working part time or not at all, we also get no statistically significant effect, F(1,34) = 0.00772, p = 0.931, partial eta-squared = 0.
Discussion…
NOTE: The example below pertains only to Writing Assignment 4.
Study 2
Results
For study two, we examined how the following two variables affected Sleep Quality: 1) the number of units taken at the university (Academic Hours); and 2) the intensity of one’s overall workload situation (Workload Intensity), which included academic as well as non-academic workload. As explained in the Method section, the former, Academic Hours, was measured simply in academic units, whereas the latter, Workload Intensity, was measured on a Likert scale from 1 to 5, with 1 indicating not intense at all and 5 representing very intense.
The intensity of overall student workload is analyzed first.
Workload Intensity
We used Pearson’s r to uncover the relation between Sleep Quality and Workload Intensity. This relation can be seen below in Figure 3 below.
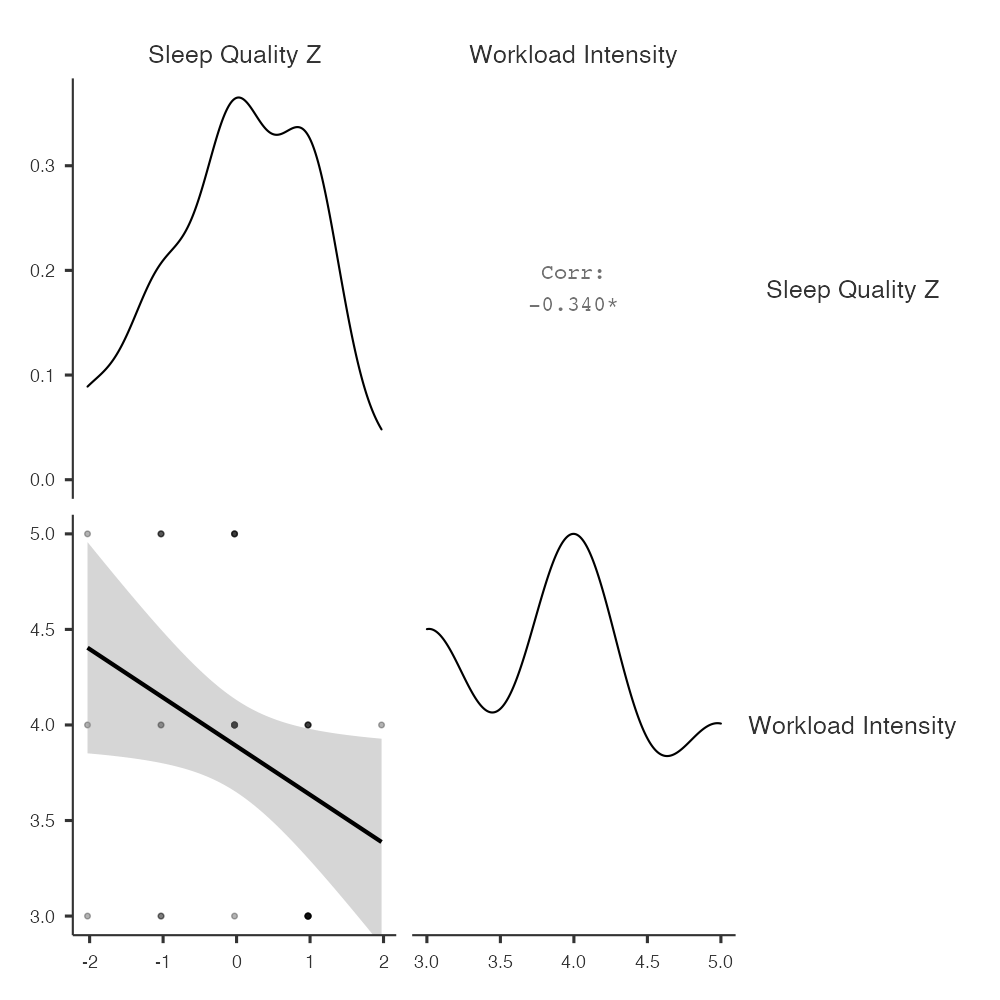
Figure 17.4: Figure 3. The effect of Workload Intensity on Sleep Quality. Both Sleep Quality and Workload Intensity are on standardized scales. (NOTE: In the 7th edition of the APA Style Manual, the figure label should actually go above the figure (unlike here), followed on the next line by a description in italics, followed below that by the figure itself)
This relation was statistically significant, r(34) = -.34, p = .043, 95% CI [-.60, -.013]. Simply put, as one’s overall workload increases, one’s quality of sleep declines.
Academic Hours
The outcome variable Sleep Quality was regressed on Academic Hours using a simple linear regression. The results can be seen in Figure 4 below.
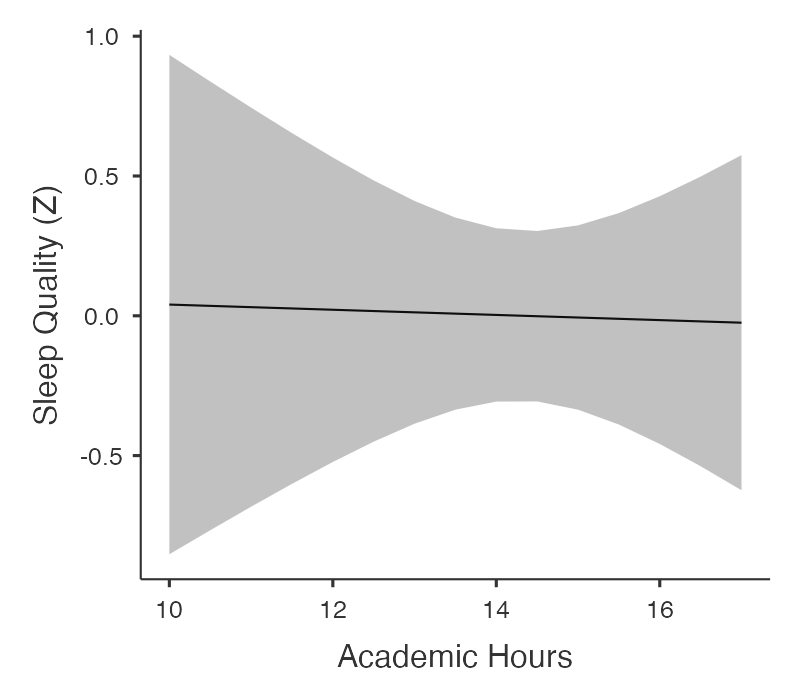
Figure 17.5: Figure 4. Workload Intensity regressed on Academic Hours. (NOTE: In the 7th edition of the APA Style Manual, the figure label should actually go above the figure (unlike here), followed on the next line by a description in italics, followed below that by the figure itself)
Sleep Quality (standardized) is predicted to be at 0.133 if a “student”165 were taking no credits at all. This intercept is not significantly different from zero, b = 0.133, t(34) = 0.097, p = .92, 95% CI [-2.66, 2.93]. This suggests, albeit rather oddly, that if a student did not register for any academic units at all, their quality of sleep would not be distinguishable from the average.
Standardized Sleep Quality did decrease by a miniscule amount (b=.0093, 95% CI [-0.203, 0.185]) for every extra academic unit taken (starting in this sample of students at 10 units). This tiny drop in quality of sleep was, unsurprisingly, not statistically significant, t(34) = -0.097, p = .92. In general then, the quality of sleep that students report seems not to be affected at all by their courseload.
Discussion…
References
Note that the value at the intercept is meaningless in this study since there are, almost by definition, no active students taking 0 units.↩︎