Navigation
jamovi is laid out such that your data, your input, is always on the left in a spreadsheet format (like Excel), and whatever analyses you apply to those data, your output, is always on the right.
There are five tabs in the uppermost menu (from left to right):
\(\equiv\) Data Analyses Edit \(\vdots\)
They are explained below in order of centrality to how most people use jamovi:
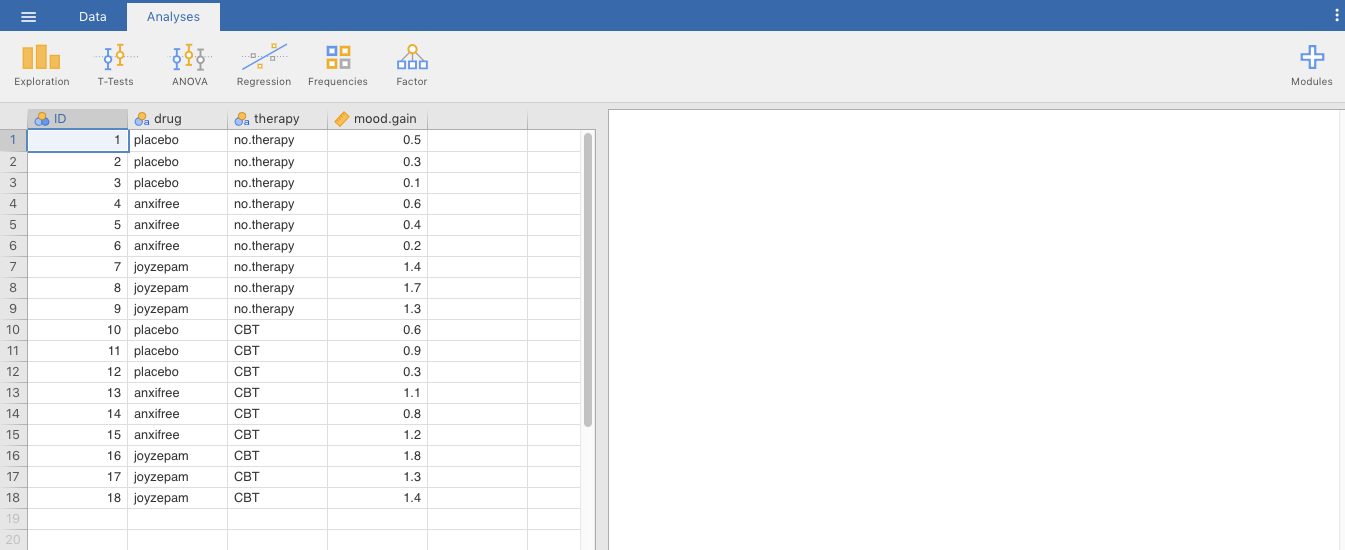
The Data tab in Figure 1.1 below shows you a set of options on how to manipulate data within the spreadsheet.
The Analyses tab in Figure 1.2 below shows you options for different statistical analyses you can run on the data that you have in the spreadsheet.
The window that occupies most of the right side of the interface is where output goes. It will be blank until you do something. We’re going to open a data set that will be used in sections below for various pedagogical reasons. We’re just going to calculate the mean for the variable called mood.gain.
In Figure 1.3 below, we have not yet done anything to the data, so the output window on the right is blank.
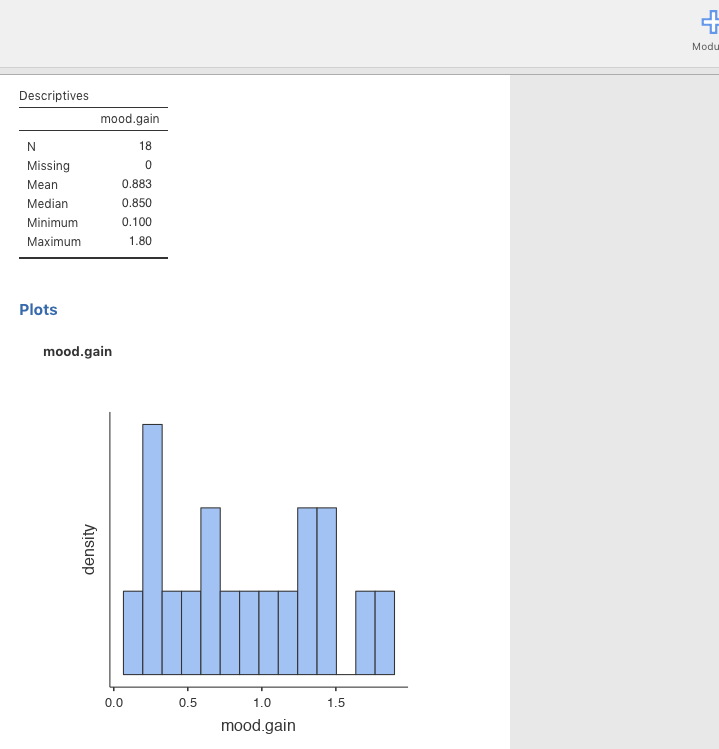
But Figure 1.4 below shows what you see in that same window after asking for descriptive statistics and a histogram (commands you haven’t learned how to execute yet) of the mood.gain variable.
As of jamovi version 1.6.0 (released at the end of August, 2020), there is a new menu called Edit. This tab is only useful after you have some statistical output. It allows you to edit the default headers that are displayed when you conduct any analysis. it also allows you to add formatted text (e.g., regular text, underlined, text, italicized text, web links, code blocks, etc.) above and below the statistical output.
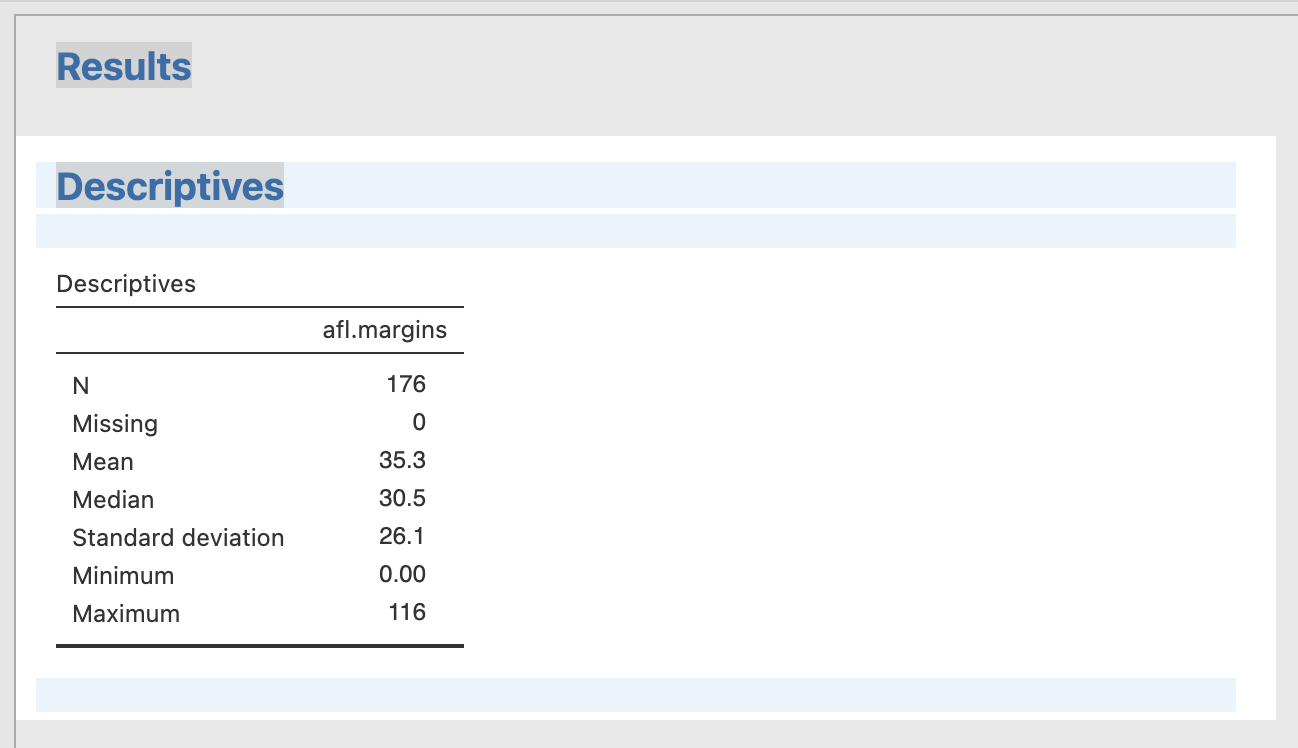
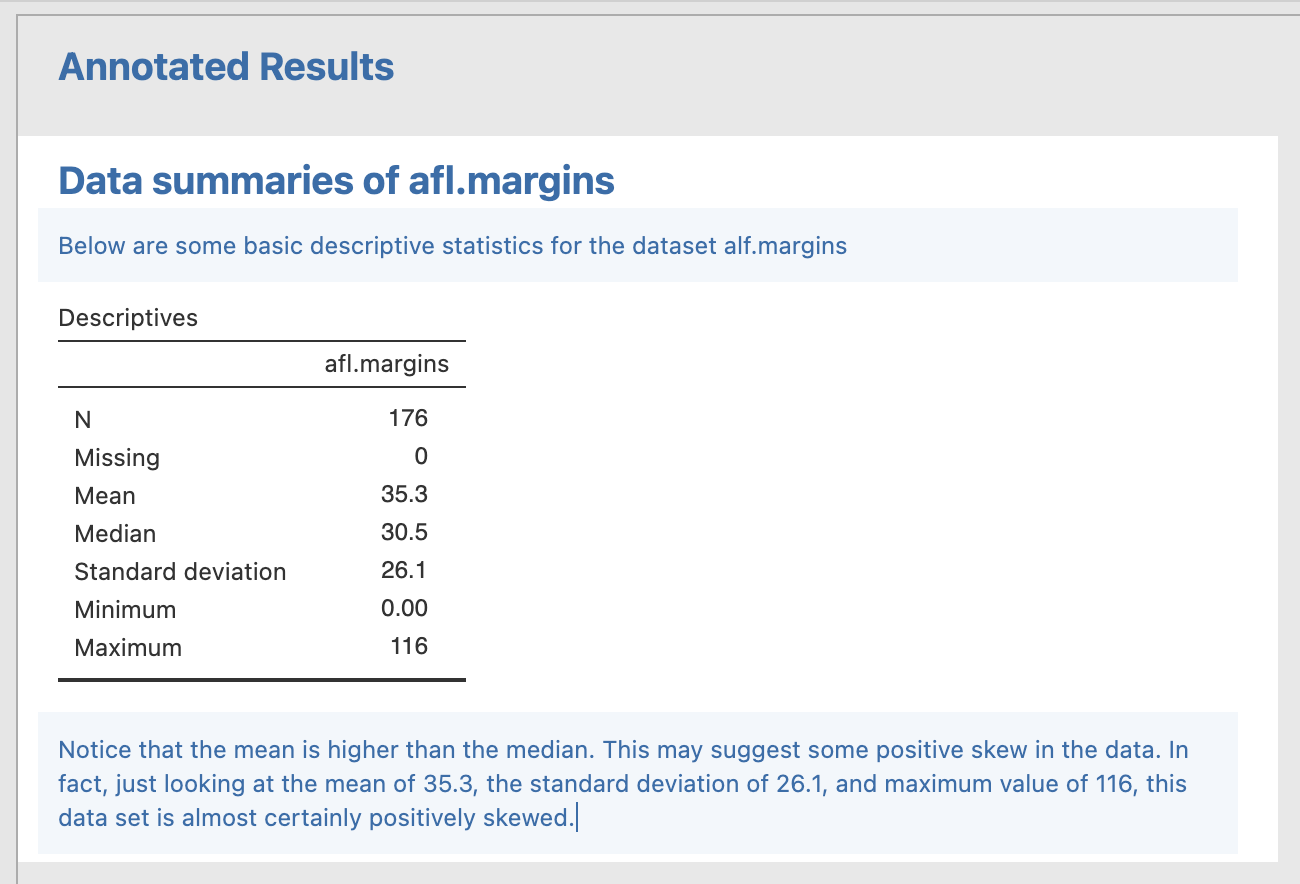
Below (Figure 1.5) is a screenshot of the default output from jamovi when you run a standard Exploration procedure on the afl.margins dataset that comes with the lsj-data module. Below THAT (Figure 1.6) are some simple changes to this default output.
- There is a
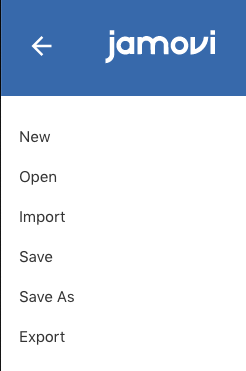
Basic operations menu on the far left that is triggered by clicking the three horizontal lines, or $\equiv$. See Figure 1.7 below. Clicking this will make some file operations slide in from the left. These are things like saving the .omv file with a name, importing data, exporting data, etc. Note that to get out of this menu option, you just need to click the big arrow. This is true for any sub-menu in jamovi.
- There is a
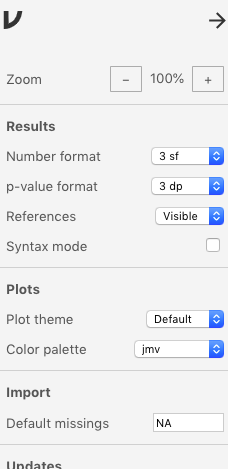
Preferences menu on the far right. See Figure 1.8 below. To activate it click the three vertical dots (\(\vdots\)). There are settings in here. You may want to change the color scheme, or round numbers to a certain number of decimals, etc. You can set these preferences here.
- Finally, there is a tab labeled
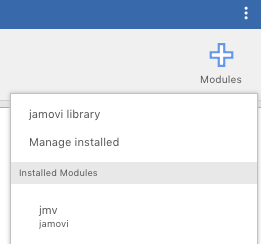
Modules on the far right when you are under Analyses (there is a plus sign, +, to identify it as well). To understand what is going on with this tab, you first have to understand that when you downloaded jamovi, you downloaded it in its base form. The base form is what the authors of the software believe will carry you through basic analyses without overloading the software and making it unnecessarily large to download and install. However, many users will want or need to carry out specific analyses that the software authors consider either unusual or extra. They provide this extra functionality in the form of modules. They are written by either the jamovi team, or in many cases, avid users of jamovi (you can do so as well, if you’re so inclined).
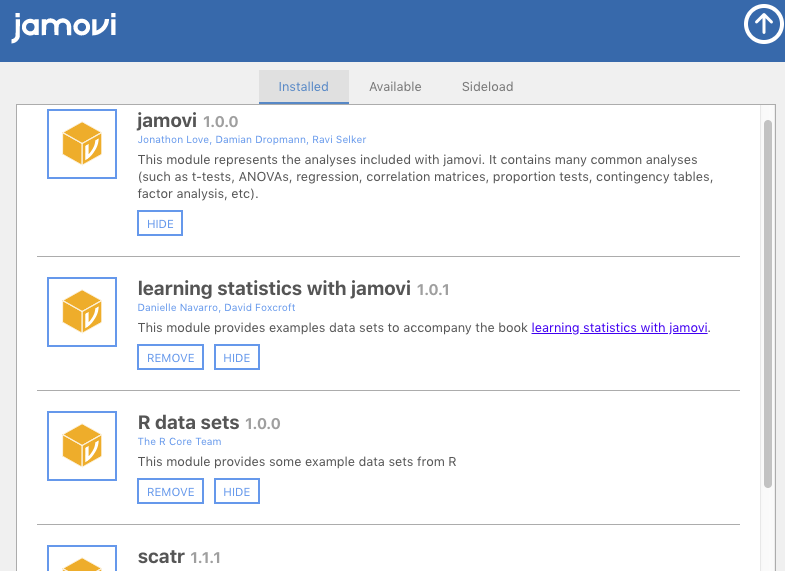
If you click this tab, and then select Manage installed, you will see a pop-up menu consisting of the available modules that are either already Installed (the upper-left tab) or Available for download (the middle tab). Do not worry about tab on the upper right, Sideload, unless you want to write and test your own module. See Figure 1.9 below.
You might notice that one module is installed by default. This is the base jamovi module that comes with the software.
And as of version 1.8, scatr is also installed by default. The scatr module lets you make nicer scatterplots than are offered in the base module. Scatterplots are relevant to Chapters 4, 7, and 15. Once installed, you will find the scatr menu under the Analyses tab, under Exploration > scatr.
However, there are some other modules you will absolutely need installed for this class. They are as follows:
learning statistics with jamovi. This module contains the data sets for your main textbook by Navarro & Foxcroft (2019). These data sets will subsequently become available under the Basic Operations icon (\(\equiv\)), where you navigate to Open > Data Library > learning statistics with jamovi, where you will then see a list of the data sets.
R data Sets. This module loads the sample data sets that come with R. You will be using one or more of these data sets in this lab manual.


